| Sankey Flow Show | Attractive flow diagrams made in minutes |
- APP
- INFO
- PRICING
- ACCESSORIES
- ABOUT
Make Sankey diagrams online directly in your browser
Sankey Flow Show
Attractive Sankey diagrams
Sankey FlowShow is the first webapp to freely draw Sankey diagrams. Loops, branches, customizable soft curves, graphical effects (such as shadows) and many other design options add a captivating quality to your Sankey diagrams. A huge amount of details such as the extensive icon and shape library, freely adjustable distances from connection lines to items, automatic indicators and many more make your work a pleasure.

Click on a thumbnail to view an example or
sign up and test Sankey Flow Show
Sign up, it's free
sign up and test Sankey Flow Show
Examples | |||
|---|---|---|---|
| Historic Steam Engine
efficiency diagram
As a tribute to Captain Sankey, this diagram was recreated with Sankey Flow Show from his original figure out of the year 1898. The original figure compares an actual steam plant with an idealized steam plant. The diagram shows just the actual steam plant where energy losses originate mainly from radiation and friction.
[Wikipedia]: "Sankey diagrams are named after Irish Captain Matthew Henry Phineas Riall Sankey, who used this type of diagram in 1898 in a classic figure showing the energy efficiency of a steam engine. While the first charts in black and white were merely used to display one type of flow (e.g. steam), using colors for different types of flows has added more degrees of freedom to Sankey diagrams." | |||
| R141b Production
process flow diagram
R141b is mainly used as a refrigerant. Other names are "1-Dichloro-1-fluoroethane" and "HCFC-141b". This diagram provides a cradle-to-gate view on the production of R141b. It was created by Dr. Thorsten Volz in the year 1997 for the purpose of Life Cycle Assessment (LCA) and as a verification sample for the development of the LCA software GaBi®, one of the first software tools with Sankey diagram capabilities. | |||
| Energy Efficiency, Lighting
efficiency diagram
The actually used light of a typical lighting system is just a small part of the consumed electric energy. The most energy is wasted as heat loss. This diagram follows the convention to show losses with arrows bounded towards the bottom. | |||
| Brewery processes
process flow diagram
Technical and chemical processes can be visualized transparently using Sankey diagrams. The example shows the process flow in a brewery. | |||
| Production-integrated environmental protection
energy flow diagram
The diagram shows the energy flow in a metalworking operation. It was created within the framework of production-integrated environmental protection. | |||
| Household Energy Costs
drill down tree
The energy consumers in a typical household are heating and cooling, water heating, lighting, refrigerator, clothes washer, dish washer, electronics and some others. Drill down trees consist of one or more aggregation levels. The diagram shows the aggregated costs of all electric devices as well as the details on the tree's sub level. | |||
| Signup Workflow
workflow diagram
Workflow diagram for the sign up process of a web app. The user can choose between native sign in and single sign in via a AUTH2 provider. The native sign in requires the verification of the email address. The arrow widths show the expected incidences. Decisions are shown with colors: YES = green, NO = red. | |||
Click on a thumbnail to view an example or
sign up and test Sankey Flow Show
Sign up, it's free
sign up and test Sankey Flow Show
Created with Sankey Flow Show Wizards | |||
|---|---|---|---|
| Synthesis, In-Out
in-out diagram
The chemical synthesis sample visualizes input and output materials in relation to each other. It was generated with the Sankey Flow Show wizard "Simple In-Out". The "Simple In-Out" wizard helps to create items with an arbitrary number of inputs and outputs. The wizard dialog provides easy and fast methods to add inputs and outputs and related amounts. The basic layout and formatting is done automatically and reduces the later manual fine tuning to a minimum. | |||
| Energy Producers vs. Consumers
producer consumer diagram
The sample energy production and consumption items are linked to a single connection. It was generated with the Sankey Flow Show wizard "Producer vs. Consumer". The "Producer vs. Consumer" wizard helps to create a single connection with an arbitrary number of producers and consumers. The wizard dialog provides easy and fast methods to add producers and consumers and related amounts. The basic layout and formatting is done automatically and reduces the later manual fine tuning to a minimum.The sample energy production and consumption items are linked to a single connection. It was generated with the Sankey Flow Show wizard "Producer vs. Consumer". The "Producer vs. Consumer" wizard helps to create a single connection with an arbitrary number of producers and consumers. The wizard dialog provides easy and fast methods to add producers and consumers and related amounts. The basic layout and formatting is done automatically and reduces the later manual fine tuning to a minimum. | |||
| Company Comparision
comparison diagram
The company comparison diagram shows company revenues and a benchmark face-to-face. It was generated with the Sankey Flow Show wizard "Comparison". The "Comparison" wizard helps to create a comparison of two items with an arbitrary number of categories. The wizard dialog provides easy and fast methods to add categories and related amounts. The basic layout and formatting is done automatically and reduces the later manual fine tuning to a minimum. | |||
| BOM Tree
drill down tree
The Sample bill of material shows the levels "product", "assembly", "sub assembly" and "part". It was generated with the Sankey Flow Show wizard "Drill Down Tree". The "Drill Down Tree" wizard helps to create sankey diagrams with tree structures containing an arbitrary number of levels and of items on each level. The wizard dialog provides easy and fast methods to add levels, items and related amounts. The basic layout and formatting is done automatically and reduces the later manual fine tuning to a minimum. | |||
| Generic Meshed Columns
meshed columns diagram
The generic sankey diagram shows three meshed columns. It was generated with the Sankey Flow Show wizard "Meshed Columns". The "Meshed Columns" wizard helps to create items in columns. The items in a column are meshed with the items in the next column in a matrix manner. The wizard dialog provides easy and fast methods to add columns, items and related amounts. The basic layout and formatting is done automatically and reduces the later manual fine tuning to a minimum. | |||
Click on a thumbnail to view an example or
sign up and test Sankey Flow Show
Sign up, it's free
sign up and test Sankey Flow Show
...made in minutes
Sankey FlowShow saves your time! The clean separation of design and data layer, the automatic unit conversion, the user-friendly drag'n'drop and much more makes the drawing straightforward and easy. And if your requirements grow beyond pure drawing, you'll be amazed at how powerful the possibilities of Sankey Flow Show are, to modeling mathematical dependencies and scenario management.

CLICK OPTIMIZED

MAGNETIC SNAPPING

ASSISTING LINES

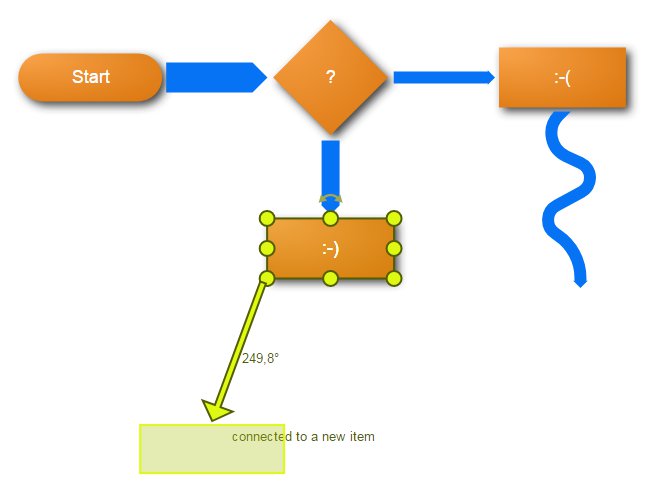
ANGLE INDICATORS

SHAPES/ICONS LIBRARY

COLOR PALETTES

USER SETTINGS

WIZARDS

AND AND AND
- . . .
- Draw clear and attractive Sankey diagrams
- Promote your presentations with insightful Sankey diagrams
- Get more attention for your website with interesting Sankey diagrams
- Explain circumstances visually
- . . .
No installation, never miss an update... Sankey Flow Show is a modern web application running in your browser. Share your work with others, export your diagrams to standard formats (svg, jpg, png, pdf, etc.), view and restore previous revisions, collaborate live and stay ahead of your competitors. - What are you waiting for? Test Sankey Flow Show now!