| Sankey Flow Show | Attractive flow diagrams made in minutes |
- APP
- INFO
- PRICING
- ACCESSORIES
- ABOUT
Online help: Diagram design
Basic terms | |
|---|---|
| Items, connections, diagrams... | |
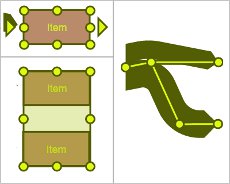
| Just a handful terms at the beginning: Here is an "Item" with it's "Inputs" and "Outputs"... |  |
| ... and a "Connection" with it's "Producer" and it's "Consumer". | 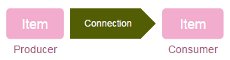 |
| Connection widths are shown proportional to certain amounts. That's the basic idea of a Sankey diagram. | 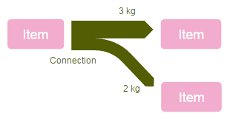 |
| A "Diagram" can contain multiple items and connections. | 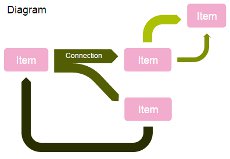 |
General | |
|---|---|
| Button bar, text properties, line properties... | |
The button bar provides access to frequently used functions in Sankey Flow Show. To see the function names, associated to an icon: Move the mouse pointer over an icon and wait a second (without moving the mouse). - In the picture below, you see the icons "menu", "revision panel", "undo", "redo", "zoom in", "zoom 100%", "zoom out", "add item", "delete", "paint format", "paint to default", "effects standby" | |
 | |
Most functions are triggered with a simple click at the icon. Some need a workflow:
| |
Text properties (see picture) are available for following diagram elements
The second button row "Text position" is available just for items, to set the text position relative to the item shape or icon. To see a function name, move the mouse pointer over an icon and wait for a second. |
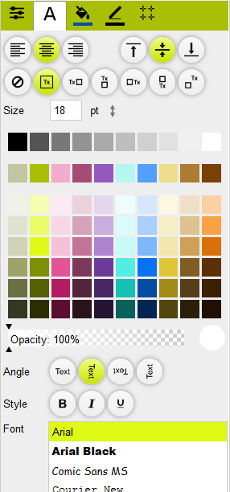 |
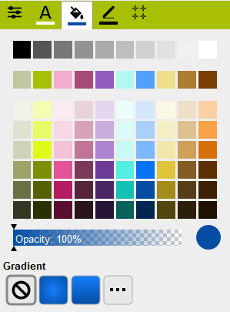
Fill properties are available for following diagram elements:
Below the color field, you can see the opacity picker. Right to it, there is a small rectangle showing the currently selected color. You can click this rectangle to show your browsers native color dialog (just available in some browsers). |
 |
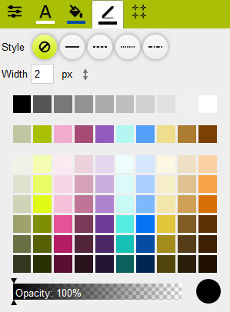
Line properties are available for following diagram elements:
Please select a line style other than "hidden" to see an effect of a property change. |
 |
The working area | |
|---|---|
| Select, move, connect, add curves... | |
| Select
You can select one or many items, one or many connections and the legend. The "properties and details" panel shows the design and data properties of the selected elements. If no element is selected, the properties of the diagram itself are shown. You cannot select elements of different types at the same time (e.g. items and connections). How can I select (multiple) elements?
|
 |
| Move and size Drag an item to move it and drag one of the round selector handles to size an item. When you move an item, the connections attached to it will follow automatically. -> Try to move multiple items and see what is happening to the connections in between them. | |
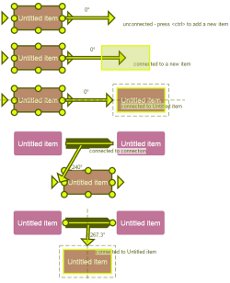
| Connect
The picture on the right shows several ways to create connections:
|
 |
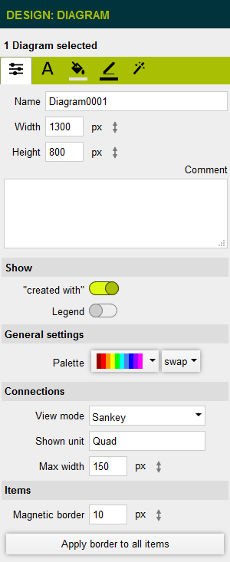
| Add/remove curves to/from a connection
Add: Select a connection and drag a highlighted line segment as shown in the picture on the right Remove: Click at a round handle of a selected connection (without moving) |
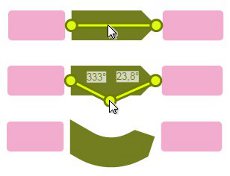 |
Diagram properties | |
|---|---|
| Legend, general settings... | |
To select the diagram itself, click at the (white) diagram surface. The design properties will adjust as you can see in the picture on the right. Here are some hints to particular diagram properties:
|
 |
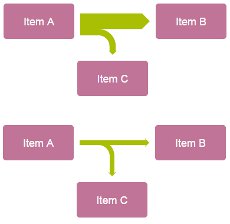
The legend of a diagram can be shown optionally with the checkmark behind "show legend" below "design" in the diagram properties. Each connection of a diagram has a property "show in legend", which is checked by default. |
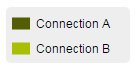 |
| View mode
Sankey: Show values with proportional connection widths (see upper part of the picture). Constant width: Show all connections of a diagram with the same width (see lower part of the picture). |
 |
Item properties | |
|---|---|
| Shape, effects, alignment... | |
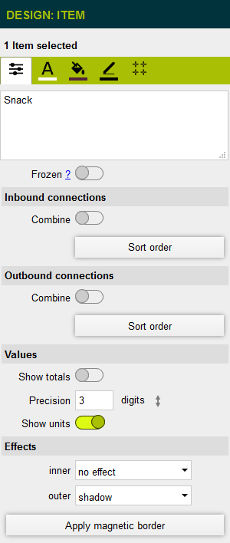
Select one or multiple items of a diagram to see the item properties as shown in the picture on the right. Here are some hints to particular properties:
|
 |
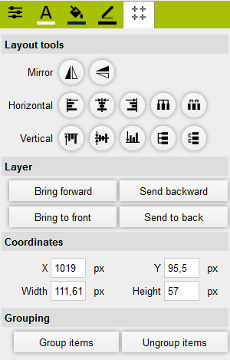
| Layout tools Before you use the layout tools, select multiple items of a diagram. |
 |
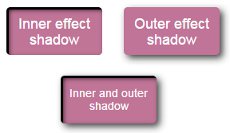
You can add an inner and an outer effect to an item. Both effects can be combined as shown in the picture on the right. Hint: An outer shadow can increase the contrast and in this way help to get a clear picture. Use the other effects sparingly to set accents in your diagram. |
 |
| When "show totals" is checked, all inputs and all outputs of an item are summed up to a total value. The totals will be shown below the caption of an item. If the inputs total and the outputs total are equal, then only a single number will be shown. | 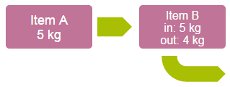 |
Connection properties | |
|---|---|
| Roundness, arrow heads, indicators... | |
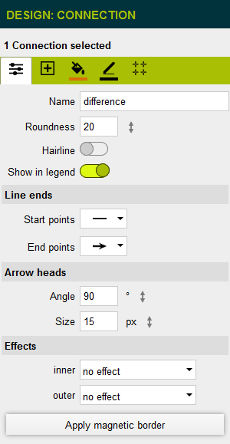
Select one or multiple connections of a diagram to see the connection properties as shown in the picture on the right. Here are some hints to particular properties:
|
 |
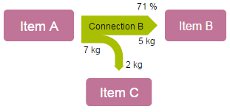
There are three different kinds of tags:
To add a tag, select a connection with a click, find "Design -> Tab: tags (icon: box with a plus)" and click one of the "Add xxx" buttons. Move an indicator next to different segments to see the shown value changing appropriately. You can add multiple indicators to the connection. The maximum is 1 per segment. |
 |